
The following essay will appear in Climates: Architecture and the Planetary Imaginary, published this spring by the Avery Review and Lars Müller Publishers.
It must have been frustrating for an explorer with such tenacity to be so soundly defeated at measuring the depth of the ocean. Sailing west across the Pacific in 1521, on a voyage that would eventually circumnavigate the globe—and prove indelibly the spherical shape of the earth—Ferdinand Magellan lowered a weighted line to measure the fathoms below.1 When the line dropped 750 meters without contact, he ordered it pulled up, declaring the ocean immeasurable. It was utterly apparent his tools were no match for the ocean’s scale and vastness, its impenetrable watery territory. As technology has advanced into the twenty-first century, scientists and ocean explorers have continued to develop new and better methods to measure these depths—from longer weighted lines to echo and sonar, to satellite imagery and submersibles outfitted with GPS. But although humanity has now compiled vast amounts of data into maps, diagrams, and digital models, the full scope of the ocean—the hydraulic, topographic, geologic, and biological systems that comprise more than 70 percent of the Earth’s surface—have yet to be fully comprehended.
Nearly five centuries of marine discovery notwithstanding, the ocean remains largely unknown, unmeasured, and unmapped.2 This is problematic for many reasons: the ocean is responsible for the production of food, water, and, most importantly, oxygen; as a site of carbon sequestration, it is one of our major defenses against climate change. And yet—because much oceanic territory remains unexplored, humans struggle to grasp the connection between our survival and a healthy marine ecosystem. Compounding this situation are glaring misconceptions about the ocean that remain embedded in public consciousness. Our inability to experience the ocean as we do land has contributed to a view of the ocean as an eternally bountiful, self-sustaining entity too vast and mysterious to require our protection.
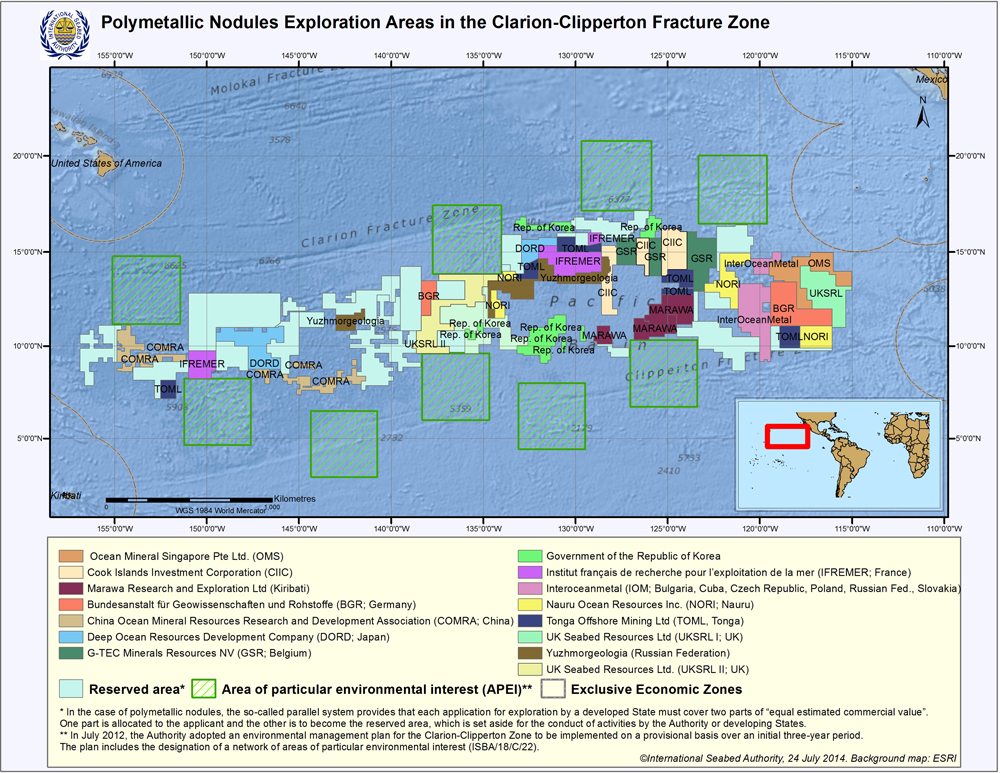
Maps can be one of our most powerful tools in changing humans’ understanding of the ocean. By depicting the Earth as an interconnected ecosystem, with land and ocean mutually dependent, they can effectively reveal that biodiversity, geology, and the need for resource protection do not stop at the shore. To do so, however, mapmakers need to navigate a tricky balance of data, accuracy, and politics. Two maps in particular demonstrate this point, exhibiting two extremes of a continuum: the 1957 map of the Atlantic Ocean floor by Marie Tharp and Bruce C. Heezen, and a less widely circulated, more recent map of the Clarion-Clipperton Fracture Zone (CCZ) in the Pacific Ocean, published by the International Seabed Authority (ISA) in July 2014.
Tharp and Heezen’s map, a physiographic diagram, is revolutionary for depicting the topography of the ocean floor in three dimensions for the first time. It also unearthed a discovery that upended previous scientific beliefs and fundamentally altered the way we understand the planet today. The map was the first to locate the Mid-Atlantic ocean ridge and its rift, providing evidence in support of the theory of continental drift, now known as the science of plate tectonics. It is also the first map to identify fracture zones—linear ridges and troughs in the ocean’s crust that evidence past plate movements. Tharp and Heezen’s deliberate graphical choices—chiefly, their decision to apply the physiographic style of land-based diagrams to the ocean, which allowed them to show explicit topographic connections between the ocean floor and terrestrial landscapes, and therefore depict traces of the forces of plate tectonics—made the inaccessible accessible to a general audience, all the while hinting at the mechanisms by which the world was formed.
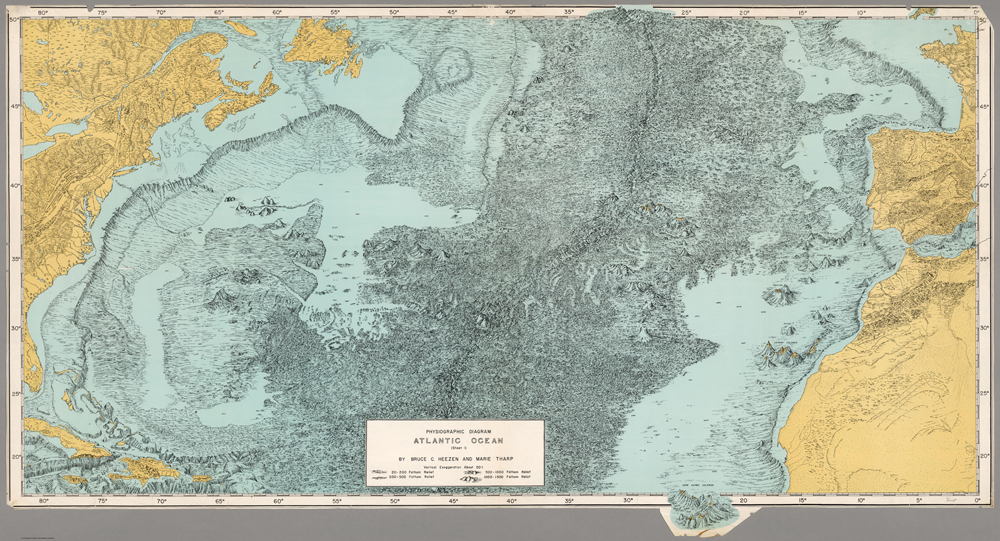
Compared to maps made with contemporary technologies, Tharp and Heezen’s hand-drawn map from 1957 is a “low-resolution” image of the ocean floor. Nevertheless, it provides a key framework for the many ways we use the ocean today, even in spite of the restrictive context in which it was created. National claims to the ocean have a complex history, bound up in issues of State power and the control of resources. World War II remapped the European continent and its colonial extents, sparking a renewed focus on claiming oceanic territory and resources. It was during this time that Tharp and Heezen began their work, and the form of their map reflects these tense postwar political conditions—in particular, rising Cold War paranoias. Fears of Soviet submarine warfare led the U.S. government to make precise ocean depths classified information. Tharp and Heezen surmounted this challenge not only by employing a physiographic style for their map but also by using a hachuring technique, exaggerated at a scale of 40:1, to emphasize a sense of depth while obscuring factual information.
Decades before Tharp and Heezen ever met, in 1921, a German scientist named Alfred Wegener put forth the theory of continental displacement, or continental drift. Veering radically from accepted beliefs of the time, Wegener’s theory postulated that the continental landmasses were “drifting” across the Earth. Having studied the fossils of ancient reptiles and plants as well as rocks and mountain ranges across the world, Wegener was convinced that all of Earth’s continents were once part of an enormous, single landmass, an Urkontinent, commonly known today as Pangaea.3 Most scientists strongly rejected Wegener’s theory; more than a half-century later, Tharp and Heezen would meet similarly heated resistance against the bold ideas revealed in their map of the ocean floor.
The first two-dimensional map of the Atlantic Ocean floor was created from soundings collected between 1872 and 1876 by a team of British scientists aboard the HMS Challenger, a refitted Royal Navy warship. Although a wireline sounding machine had been recently developed by Irish physicist and engineer Sir William Thomson, one of many iterative advances in this method of data collection made throughout the late nineteenth century, the Challenger employed various hemp-line sounding machines.4 The wireline machine and other improvements would soon make the sounding process faster and more accurate, but for the Challenger crew, it remained an arduous process and fairly approximate: the ship stopped every 200 miles, at which point its scientists used the sounding machines and other equipment to lower a fathometer (a weighted line marked by flags) to record the measured distance between the water’s surface and the ocean floor. In 713 days at sea, the HMS Challenger collected 492 soundings.
As people came to use the ocean increasingly to connect continents via transportation and communication networks, the desire to develop new ways to map its myriad features grew at an unprecedented pace. The speed and quantity of oceanic data collection became a public priority after the sinking of the Titanic in 1912. Following the end of World War I, advanced sonar technology developed during the war soon replaced the weighted lines of manual soundings to measure the ocean’s depth. The establishment of the International Hydrographic Bureau (today the International Hydrographic Organization) in 1921 compelled a significant increase in the speed, quantity, and, crucially, the accessibility of oceanic data collection, as the Bureau began compiling data from all of its member nations into the General Bathymetric Chart of the Oceans (GEBCO). Through GEBCO, the Bureau began standardizing the nomenclature and terminology of such information, incentivizing oceanic data collection and bringing the work of the international scientific community to the public on a much larger and broader scale.5 One mission of particular significance during this period was that of the Meteor, a German survey vessel, which traversed the southern Atlantic thirteen times between 1925 and 1927, collecting 67,338 sonar soundings that provided the data for a much more accurate depiction of marine topography.
It was in the wake of this period of intense data collection that Tharp and Heezen began work on their map of the Atlantic Ocean floor while at Columbia University’s Lamont Geological Observatory under Dr. Maurice Ewing. Between 1947 and 1952, Ewing, Heezen, and Ewing’s students collected their own sounding records across the Atlantic. Because the paths of the ships were inconsistent, the soundings were incomplete. Tharp developed a process to piece them together, “splicing about three thousand feet of sounding records into six complete paths … representing about a hundred thousand miles of travel.”6 Using these compiled soundings, she then translated the data into topographical profiles, or cross-sectional views, of the ocean floor.
Plotting the sounding data onto two-dimensional graphs that would ultimately form her profiles, Tharp was able to confirm the location of a “wide medial ridge that had been surmised by oceanographers since the late nineteenth century.” This was not exactly revelatory; oceanographers on the Meteor had produced similar profiles twenty years prior. But probing further, Tharp noticed something startling: a rift, or, in her own words, “a deep notch near the crest of the ridge.” As she would later write, “If there was such a thing as continental drift, it seemed logical that something like a mid-ocean rift valley might be involved. The valley would form where new material came up from deep inside the Earth, splitting the Mid-ocean ridge in two and pushing the sides apart. That, in turn, would move the continents on their various tectonic plates.”7
To prove the accuracy of her analysis and thus the existence of the rift to a skeptical Heezen, who saw it as a dangerous subversion of scientific orthodoxy, Tharp began converting the profiles into a single drawing that could more realistically communicate the data. Working on a related project, they “had found a definite association of topography with seismicity.” Plotting the known locations of earthquake epicenters along with the data from the soundings, and then interpolating and extrapolating between known data points, Tharp identified the extent of the rift valley. She noticed that the epicenter locations “led south through the Atlantic, around the African cape, north into the Indian Ocean, west into the Gulf of Aden, and then made landfall in the form of the East African Rift.” A few decades prior, seismologists Beno Gutenberg and Charles F. Richter had first noted a relationship between earthquake epicenters and the oceanic ridge. But Tharp could trace her rift nearly continuously across the world, not only discovering a “forty-thousand mile long underwater structure, quite possibly the largest geologic feature on Earth,” but proving its relationship to seismic activity, lending credence to the theory of continental drift.8
Contemporary reactions to Tharp’s discovery, and the map that she and Heezen developed to graphically communicate it, were far from favorable—their ideas and their map were fervently criticized as works of imagination, both by the scientific community and the public at large. It would take Jacques Cousteau and his Troika camera to turn the tide, screening physical proof of the ridge and its rift valley at the 1959 International Oceanographic Conference. Cousteau’s video led to expanded support for Heezen’s data collection and Tharp’s mapping, resulting in a spate of new oceanic breakthroughs.
But even with filmic evidence, and in spite of many other technological advances made over subsequent decades, achieving agreement about the ocean, and the data collected about and within it, remains far from easy. Consensus proves especially difficult when viewing such data through the lens of largely arbitrary man-made laws and systems developed for terrestrial landscapes. For instance, the United Nations Convention on the Law of the Sea (UNCLOS), which defines the boundaries of national jurisdiction along the ocean floor as well as the adjudication of international waters, was opened for signatures in 1982 after a decade and a half of deliberations. It was not ratified until 1994—all told, involving nearly twenty-six years of deliberations “by more than 150 countries representing all regions of the world, all legal and political systems and the spectrum of socio/economic development.”9 (Significantly, as of this writing, the United States has yet to officially recognize the convention, despite participating in the negotiation of its terms.)
In addition to its clear establishment of the “rights, duties, and jurisdictions of maritime states…the limits of a country’s ‘territorial sea’…rules for transit through ‘international straits’ and [the boundaries of] ‘exclusive economic zones,’” the convention also establishes international waters—the High Seas, which are beyond the claim of any nation and cover 63 percent of the ocean’s floor.10 As technological advancements and infrastructure have come to dominate life in new and unanticipated ways, the High Seas are being reconsidered, with various countries laying claim to territories previously declared unclaimable. Current technologies (including remotely operated deep sea submersibles, LiDAR, and GIS) are also allowing us to reach new depths and discover more of the ocean floor. They have enabled scientists, private and public corporations, and other entities to identify areas where they believe valuable mineral deposits are located, spurring new claims to the seabed to mine these deposits for the minerals used in the manufacturing of cellphones, computers, and other devices.
To oversee exploration, mapping, and resource management in the High Seas, the UN Convention formed the International Seabed Authority (ISA) in 1982. The map of the Clarion-Clipperton Fracture Zone that the organization released in 2014, the result of much international collaboration and advanced technical knowledge, is disappointingly little more than a prospector’s map. It shows proposed claims made by different countries on a remarkably mineral-rich area, located on the deep ocean floor in the middle of the Pacific, that stretches as wide as the continental United States and lies outside any national jurisdiction.
Like all maps, Tharp and Heezen’s physiographic diagram of the Atlantic Ocean floor and the ISA’s image of exploration areas in the CCZ are examples of data organized in a deliberate graphic style to communicate a specific point of view. As graphic tools, they have strategic viewports and scales chosen to articulate a clear message to an intended audience. In the case of Tharp and Heezen’s map, the process of visualizing the remote ocean floor led to a great shift in our understanding of the dynamic geological events that continue to shape the planet. The ISA’s map looks to imminent events, geological in nature but this time human-made, hinting at a future in which the ocean is viewed fully as a privatized, parcelized commodity. Both maps mobilize standards of geological representation to create a specific image of the ocean—ultimately, rendering it as an exploitable territory.
Despite ever-more sophisticated sonar technology, to date, a mere 5 percent of the ocean has been mapped in high resolution.11 Compare this to the 100 percent high-resolution mapping of the surfaces of Mars and the Moon, and the implications of this disparity vis-à-vis humanity’s ability to respond to climate change begin to come into view.12 If colonizing outer space seems more viable than looking to the ocean, where climate change can be mitigated here on Earth, then that disparity places an arbitrary limit on the scope of our imaginations and ability to act in response to the climate crisis.
Oceans, and their territorial ambiguity, have long been used as a tool for political, economic, and social manipulation, with some of the most recent fearmongering headlines warning of an impending Russian plot to dismantle Internet cables on the ocean floor.13 With little land now left to parcel out and plumb for resources, governments have turned to the space of the ocean, contesting the precarious boundaries between Exclusive Economic Zones and asserting new claims in the High Seas. Because the majority of the ocean lacks sovereignty, its territory has no representation in, and no safeguard against, any of the policies, politics, and resulting consequences to which it is subjected; and those areas of the ocean that are claimed without dispute are not necessarily protected from harm. Forty-two percent of the ocean is “claimed” by national interests (through Exclusive Economic Zones). Only 2 percent of the ocean is actively safeguarded as “marine protection areas.”14 As it has throughout history, the ocean provides a link between sovereign spaces, but it does not share the same protections that have been established for terrestrial environments. Despite land-based conservation efforts, upland, tidal, and freshwater resources are nearing the brink of collapse, calcifying this shift in focus to the oceans’ depths as a critical future site for resource extraction.15
Areas outside the internationally recognized Exclusive Economic Zones are considered part of the “common heritage of man” and placed under a trusteeship managed by the International Seabed Authority.16 As of July 2015, however, with support from the ISA, a twenty-first-century gold rush is set to begin on the ocean floor—specifically, within the CCZ. Singularly biodiverse (it is home to a range of habitats and species found nowhere else in the world), the CCZ is also rich with many of the minerals and metals used to manufacture the infrastructure that makes modern life possible. Smartphones and computers are included in this list as well as construction materials, wind turbines, and a host of common household appliances. With its excavation set to be carried out by an internationally governed, multinational team of experts mobilizing state-of-the-art technologies, the CCZ’s imminent strip-mining makes clear that the ocean’s deepest layer—long considered beyond human experience and comprehension—is “open for business.”
The magnitude of the damage to the 6-million-square-kilometer zone of the CCZ reserved for resource extraction cannot be fully anticipated, as the scale of mining is unprecedented and the ecosystems at this depth of the ocean are not fully understood. A cross-disciplinary team of oceanographers, biologists, ecologists, and environmental advocates recently addressed this threat in an article published in Science magazine for which our office, Studio Gang, provided imagery. Weaving their research findings with a call for a new type of conservation protocol, they implored the ISA to consider developing “a process to establish regional environmental management plans as part of the framework for governing both explorations and exploitations of deep sea-bed minerals that includes a network of no-mining areas.”17
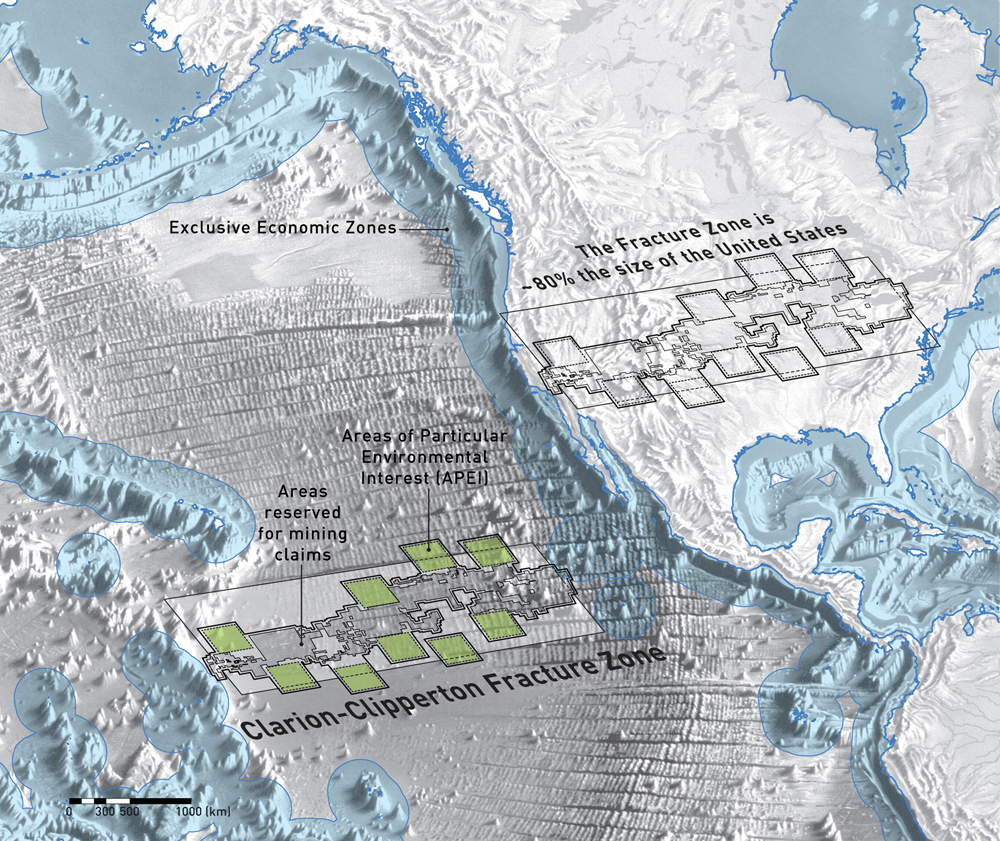
These urgent requests to study the life in the fracture zone’s marine environment are graphically represented in both the ISA’s and our image as loosely defined, disconnected green squares. Lacking official representation, they hover awkwardly outside the zone of national claims, like uninvited guests without seats at the table. Thus far, those who have invested the most in visualizing the CCZ are those seeking to profit from extracting and selling its natural resources—corporations, governments, and other organizations, like the ISA itself, that are intent on gauging the value of the materials found in the seabed. Using advanced remote sensing methods such as LiDAR (a pulsed laser system capable of accurately and precisely mapping the ocean floor), they have gathered a tremendous amount of three-dimensional data from the CCZ. The images they have developed from their data, however, clearly show the narrow scope of their interests. Intent on delineating existing mineral and metal deposits in order to most efficiently mine them, and to territorialize these deposits in order to negotiate the eventual flows of capital that buying and selling them will produce, their two-dimensional “floor plans” map and delimit zones with orthogonal boundaries that treat the ocean as though it were surface alone. Below the colorful parcels denoting reserved areas in the ISA’s map, the ocean is a largely featureless blue plane. Nothing about the map helps us visualize the scale of the mining set to take place, the particularities of this ecosystem, or the relationship of this area to the rest of the planet. It certainly does not pique the human imagination as Tharp and Heezen’s map did.
Although the plethora of data available today has created a widespread sense that the planet is a completely known, “open source” entity, the deployment of this information and those enriched by its analysis remain highly restricted. This condition is reflected in the ISA map’s lack of scale—the continents of North America and Asia that lie just beyond the extraction zone are not shown, removing any reference to familiar land-based features and inhabitants. Furthermore, by eliminating any large-scale landforms from the map, it is impossible for the viewer to grasp the scale of the CCZ and to intuit how mining in this area may affect human life on land.
The reality of this scale is startling—the parcels approved for resource extraction (simply labeled “Reserved Areas” on the map) are the equivalent in total surface area of almost 80 percent of the contiguous United States. But with the U.S. cropped out, viewers are not able to make this association without independent inquiry. In contrast, Tharp and Heezen’s map draws the viewer’s attention to the heavily shaded rift valley in the center, in part by framing it with familiar land masses and rendering it as an extension of the topographic features visible on land. While the valley may have once been highly controversial, technology has enabled us to intuit and verify its presence—today it is indisputable. The ISA’s map, in contrast, crops out the land, placing all of the viewer’s focus on a single feature of the ocean—the fracture zone. What is there to dispute? All context has been removed, presenting a view of the ocean that is difficult to interpret and a mining project whose ramifications are difficult to judge. While many people throughout the world rely on technologies built with the materials believed to be abundant in the CCZ, given our collective dependence on the ocean, societies at large should be demanding to know more details about this enormous project.
In the 1950s, political and social forces restricted what could be shown on a map as well as who could contribute to scientific inquiry. Because of her gender and superstitions involving women at sea, Marie Tharp was kept off the Observatory’s ships during research expeditions. Perhaps this distancing fired up her imagination, driving her to use the tools that were available to her to interpolate and layer the information she was not allowed to gather firsthand. Rather than investing her energies in collection, she employed her own spatial sensibilities and an open mind to synthesize the data gathered by Heezen and formulate conclusions.
To improve humanity’s understanding of the ocean, we now face a different challenge. As new tools help us accumulate more and more data, we face an overload, rather than a lack, of information—a vastness of data, like the vastness of the ocean itself, that has the potential to impede deeper knowledge and insight. Geopolitical realities, further complicated by corporate and commercial interests, industry, manufacturing, and transportation, will continue to play a role in the way information is shared or withheld. Design practices should begin to use our tools and techniques in resourceful ways to develop and circulate cross-disciplinary work in the rising field of marine spatial planning. Seeing information layered in insightful ways will make what exists in the space of the ocean more visible, thereby contributing to more developed scientific and lay understandings of its complex conditions.
This design challenge entails an engagement process with the ocean’s many users, including representatives of governments, industries, conservation initiatives, and even recreational bodies. Architects and urban designers, with their abilities to draw information out of diverse stakeholders and delineate spaces, are distinctly suited to lead this kind of spatial inquiry. While a public process to sustainably manage the resources of the ocean has been developed, at least in a nascent form, design thinking currently plays no role in its operation. Designers could help to address what are essentially spatial and organizational conflicts by translating these highly complex, interconnected issues into visual resources. New kinds of communicative drawings could emerge, analogous to those that organize terrestrial environments, but with an inherent temporal dimension. Though some may argue that mapping is not central to design, especially when it is focused on the ocean, this kind of deep, cross-disciplinary mapping is essential for understanding the climate changes ahead and our ocean’s potential role in addressing them.
-
Although Magellan’s voyage is commonly thought of as providing proof that the world is round, a spherical Earth was already an accepted belief in his time. The main impetus behind Magellan’s voyage, acknowledged both within his time and ours, was the pursuit of a new trade route west to reconnect Spain with the resources of the Spice Islands after the Treaty of Tordesillas placed the more practical eastern route under Portuguese control. See the History Channel, History.com, link. ↩
-
What we can and do measure and map of the ocean is its acidity and carbon content—which we believe to be increasing to potentially dangerous levels—as well as what we believe to be dwindling populations of certain species and the destruction of certain habitats. Yet it remains difficult to assess, and then to convey to the general population, just how much damage human activities have wrought. Institutions contributing key research and knowledge in this area include the National Oceanic and Atmospheric Administration (NOAA), the United States Environmental Protection Agency (US EPA), National Geographic, and the Scripps Institution of Oceanography at the University of California–San Diego. ↩
-
“On the Shoulders of Giants,” NASA Earth Observatory, link. ↩
-
T. H. Tizard, R. N., et al., “Narrative of the Cruise of HMS Challenger,” Report of the Scientific Results of the Voyage of the HMS Challenger During the Years 1873–76 (London: Longmans & Co., 1885). ↩
-
“GEBCO General Bathymetric Chart of the Oceans,” International Hydrographic Organization (IHO) and the Intergovernmental Oceanographic Commission (IOC) of UNESCO, link. ↩
-
Hali Felt, Soundings: The Story of the Remarkable Woman Who Mapped the Ocean Floor (New York: Picador, 2012). ↩
-
All quotations in this paragraph from Felt, Soundings. ↩
-
All quotations in this paragraph from Felt, Soundings. ↩
-
United Nations Convention on the Law of the Sea of December 10, 1982, United Nations Division for Ocean Affairs and the Law of the Sea, link. ↩
-
United Nations Convention on the Law of the Sea. ↩
-
National Ocean Service, “How much of the ocean have we explored?,” National Oceanic and Atmospheric Administration, United States Department of Commerce, link. As noted by Jon Copley, the ocean floor has been 100 percent mapped at approximately 5 meter resolution and partially mapped at approximately 20 meter resolution. See Jon Copley, “Mapping the deep, and the real story behind the ‘95 percent unexplored’ oceans,” October 4, 2014, link. ↩
-
Mars, the Moon, and Venus have been mapped 100 percent, 100 percent, and 98 percent, respectively, at approximately 100 meter resolution. Copley, “Mapping the deep, and the real story behind the ‘95 percent unexplored’ oceans.” ↩
-
David E. Sanger and Eric Schmitt, “Russian Ships Near Data Cables Are Too Close for U.S. Comfort,” New York Times, October 25, 2015. ↩
-
Svati Kirsten Narula, “A Blueprint for Protecting the World’s Oceans,” The Atlantic, April 25, 2014. ↩
-
Richard W. Spinrad and Ian Boyd, “Our deadened, carbon-soaked seas,” New York Times, October 16, 2015, link; Don Hinrichsen, “Appropriating the Water: A Human Thirst,” World Watch Institute, link. ↩
-
L. M. Wedding, et al. “Managing mining of the deep seabed: Contracts are being granted, but protections are lagging,” Science, July 10, 2015. ↩
-
L. M. Wedding, et al. “Managing mining of the deep seabed.” ↩
Jeanne Gang is an architect, MacArthur Fellow, and founding principal of Studio Gang, an architecture and urban design practice in Chicago and New York. Author of Reveal (2011), Reverse Effect (2011), and Building: Inside Studio Gang Architects (2012), Jeanne leads the Studio’s design work as well as its cross-disciplinary collaborations. She is currently engaged in design on major projects throughout North America, including the expansion of the American Museum of Natural History in New York City and a strategic plan for the National Aquarium in Baltimore.
Architect Claire Cahan is design director at Studio Gang. Claire has led and collaborated on many of the Studio’s architectural projects, including the National Aquarium strategic plan and the design phase of the American Museum of Natural History. Claire worked closely with Jeanne and the Center for Ocean Solutions to produce the Studio Gang image featured in Science.
Writer and editor Sarah Kramer is publications director at Studio Gang. She works closely with Studio leadership and project teams to communicate architectural and design ideas through various web- and print-based publishing projects.